Navigating the Rate Pressure: Rotation, Resilience, and the Path to Q3 Earnings
By Fauzia Timberlake, personal coach for trading options
October 12, 2026
Macro Overview of Markets
The defining catalyst governing capital markets for the week of October 5th–9th, 2026, was a persistent upward drift in benchmark U.S. Treasury yields toward fresh cycle highs, driven by stronger-than-expected economic resilience and lingering inflation anxieties. As fixed-income investors continued to reprice the Federal Reserve's policy trajectory in the face of robust economic data, rising borrowing costs created a continuous tug-of-war across asset classes. This yield pressure sparked intense intra-week sector rotation, forcing growth-heavy segments and rate-sensitive cyclicals to navigate aggressive valuation compression while capital actively sought shelter in cash-flow-generative defensive havens and energy infrastructure.
Major indices displayed impressive underlying resilience despite the macro headwind of rising yields, staging a late-week recovery pushed by optimism ahead of third-quarter bank earnings. While high-beta technology and rate-sensitive growth shares experienced choppy, headline-driven pullbacks, broad indices managed positive weekly closes led by defensive sectors and financial institutions.
Fixed income remained under sustained selling pressure across the curve. Benchmark Treasury yields drifted steadily higher throughout the week—with the 10-year yield pushing toward 5.24%—as bond markets continued to price in persistent fiscal supply concerns and a resilient domestic economy.
Crude oil experienced a volatile week, initially holding firm above the key $100-per-barrel psychological threshold amid ongoing supply and geopolitical considerations before easing back to settle near $91.85 as broader macroeconomic crosscurrents weighed on near-term demand expectations.
Precious metals traded defensively as the combined weight of firm real yields and a stable dollar triggered periodic profit-taking. Despite mid-week attempts to stabilize near technical support, gold consolidated its weekly losses within a disciplined trading band.
The crypto complex experienced downward pressure, tracking broader risk-asset chop and reacting to tighter liquidity conditions. Bitcoin faced a retracement over the course of the week, consolidating near intermediate support ranges as traders braced for heavy incoming macroeconomic data.
Strategy Corner
Based on last week's market movements, here are some trading ideas and option strategies for the readers' consideration. The positions can be scaled bigger (or smaller) to suit individual account size.
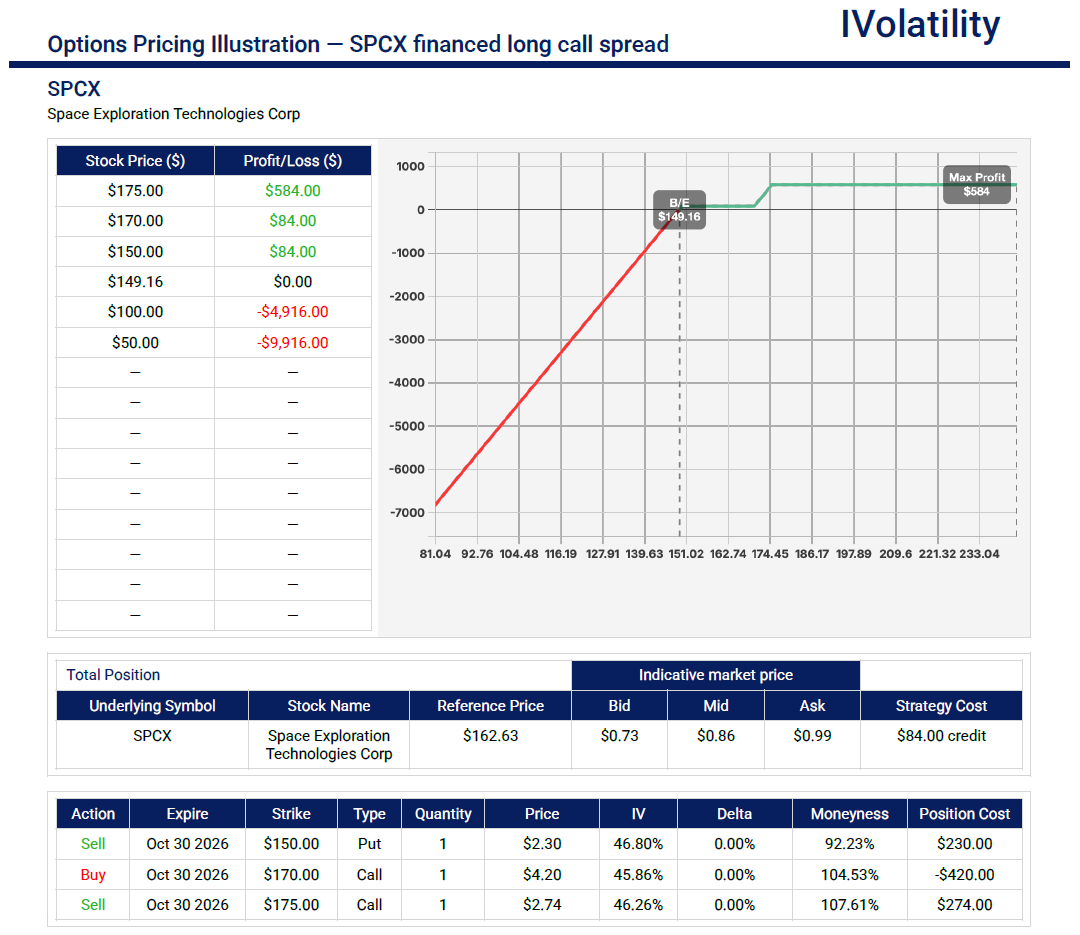
SPCX (closed around 162.06 on Friday, Oct 9th)
As SPCX approaches its upcoming earnings release, its stock primed for a pre-announcement run-up driven by institutional accumulation, strengthening industry fundamentals, and positive sentiment momentum. To capitalize on this anticipated upward trajectory traders might consider a long call spread financed by the sale of a put.
- Structure: synthetic bullish risk reversal
- Position: In the Oct 30th expiration, buy an OTM call spread inside the expected move (say 170/175) and finance it with the sale of the 150 put
- Total credit collected about $85
- Max potential profit of $600 if SPCX expires above 175 upon expiration
- No upside risk; downside risk below 150 (22 delta)
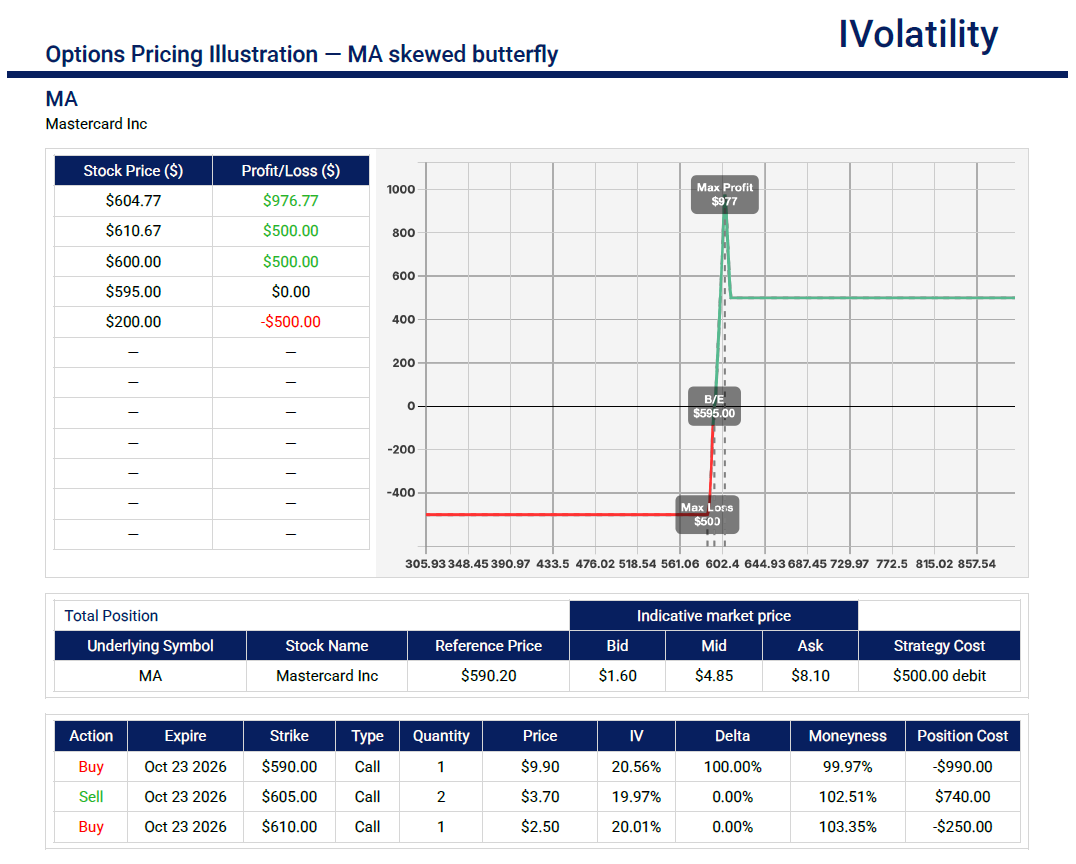
MA (closed around 589.23 on Friday, Oct 9th)
With the financial sector drawing intense institutional focus and major banks kicking off Q3 earnings week, MA may present an opportunistic setup for a defined-risk, high-reward directional play. To capitalize on robust underlying business fundamentals, sustained consumer transaction volume, and potential upside momentum through the October 16 expiration cycle, a trader may consider a defined risk upside play.
- Structure: skewed call butterfly
- Position: In the Oct 23rd expiration, buy one 590call / sell two 605calls / buy one 610call
- Total debit paid about $500
- Max potential profit of $1000 if MA pins the 605strike upon expiration
- No upside risk
Movement of the Major Market Indices:
| INDEX | UP | DOWN |
| SPY | 1.15% | |
| QQQ | -.17% | |
| IWM | 0.25% | |
| DIA | 0.86% | |
| GLD | 0.16% | |
| BTC/USD | -4.89% | |
| 10-year yield | 1.16% | |
| Crude Oil | -3.61% | |
| VIX | -2.40% |
Movement of the Major Market Sectors:
| SECTOR | UP | DOWN |
| TECH (XLK) | -0.42% | |
| FINANCIALS (XL) | 1.28% | |
| INDUSTRIALS (XLI) | 0.84% | |
| ENERGY XLE | -1.15% | |
| HEALTHCARE (XLV) | 0.65% | |
| UTILITIES (XLU) | 2.10% | |
| MATERIALS (XLB) | 0.32% | |
| REAL ESTATE (XLRE) | -0.95% | |
| CONSUMER STAPLES (XLP) | 0.50% | |
| CONSUMER DISCRETIONARY (XLY) | -0.25% |
Notable Gainers Week of Ocr 5th – 9th
The notable gainers for the week rallied strongly as investors rotated into defensive cash-generators, commodity-linked beneficiaries of elevated energy prices, and select secular growth leaders benefiting from resilient enterprise demand. Despite broader macro crosscurrents and sticky benchmark yields, capital actively sought out sectors displaying strong pricing power, robust balance sheets, and insulation from rising borrowing costs.
- Constellation Energy (CEG) surged roughly 16.5% over the week, outperforming sharply as institutional demand accelerated for reliable, carbon-free nuclear power providers positioned to supply energy-hungry data centers.
- Exxon Mobil (XOM) climbed approximately 9.2%, buoyed by firm crude oil prices hovering near triple-digit territory that strengthened upstream cash flows and enhanced near-term dividend safety.
- Palantir Technologies (PLTR) advanced around 8.4% as strong enterprise adoption of its artificial intelligence platforms and multiple high-profile contract wins attracted heavy institutional dip-buying.
Notable Losers Week of Ocr 5th – 9th
The notable losers for this week faced severe downward pressure driven by a potent mix of surging Treasury yields pushing toward fresh cycle highs, lingering margin anxieties across capital-intensive industries, and sharp investor rotation away from high-beta tech and consumer segments. As borrowing costs remained elevated and corporate guidance emphasized mounting cost pressures, several prominent names experienced steep valuation contractions and heavy institutional selling.
- Super Micro Computer (SMCI) tumbled roughly 18.2% over the week, suffering aggressive profit-taking and valuation compression as high-beta artificial intelligence hardware names experienced heavy institutional trimming amid broader tech sector chop.
- Tesla (TSLA) dropped approximately 14.5% as investors digested intensifying price competition in international electric vehicle markets alongside higher discount rates weighing on long-duration growth valuations.
- Lennar Corporation (LEN) fell around 12.8% as benchmark mortgage rates hovered near multi-decade highs, severely impacting buyer affordability, order momentum, and near-term housing delivery prospects.
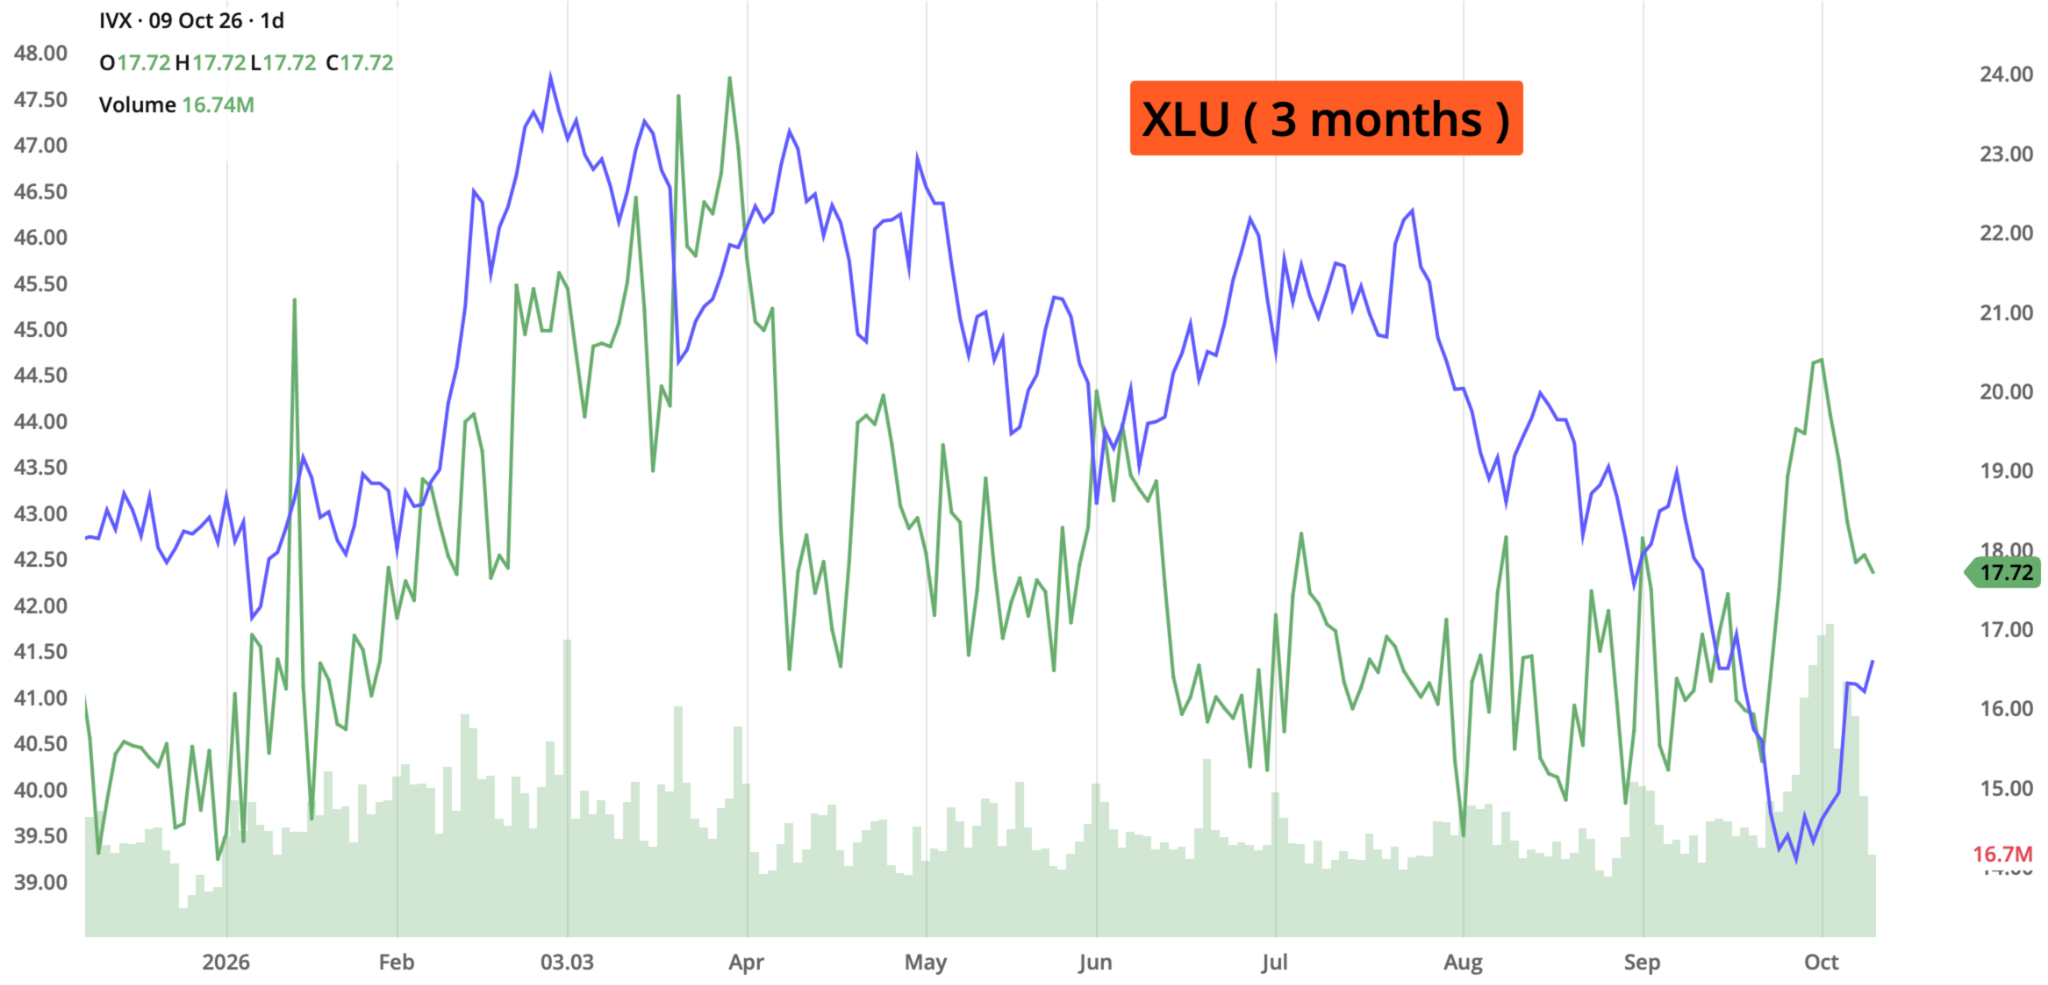
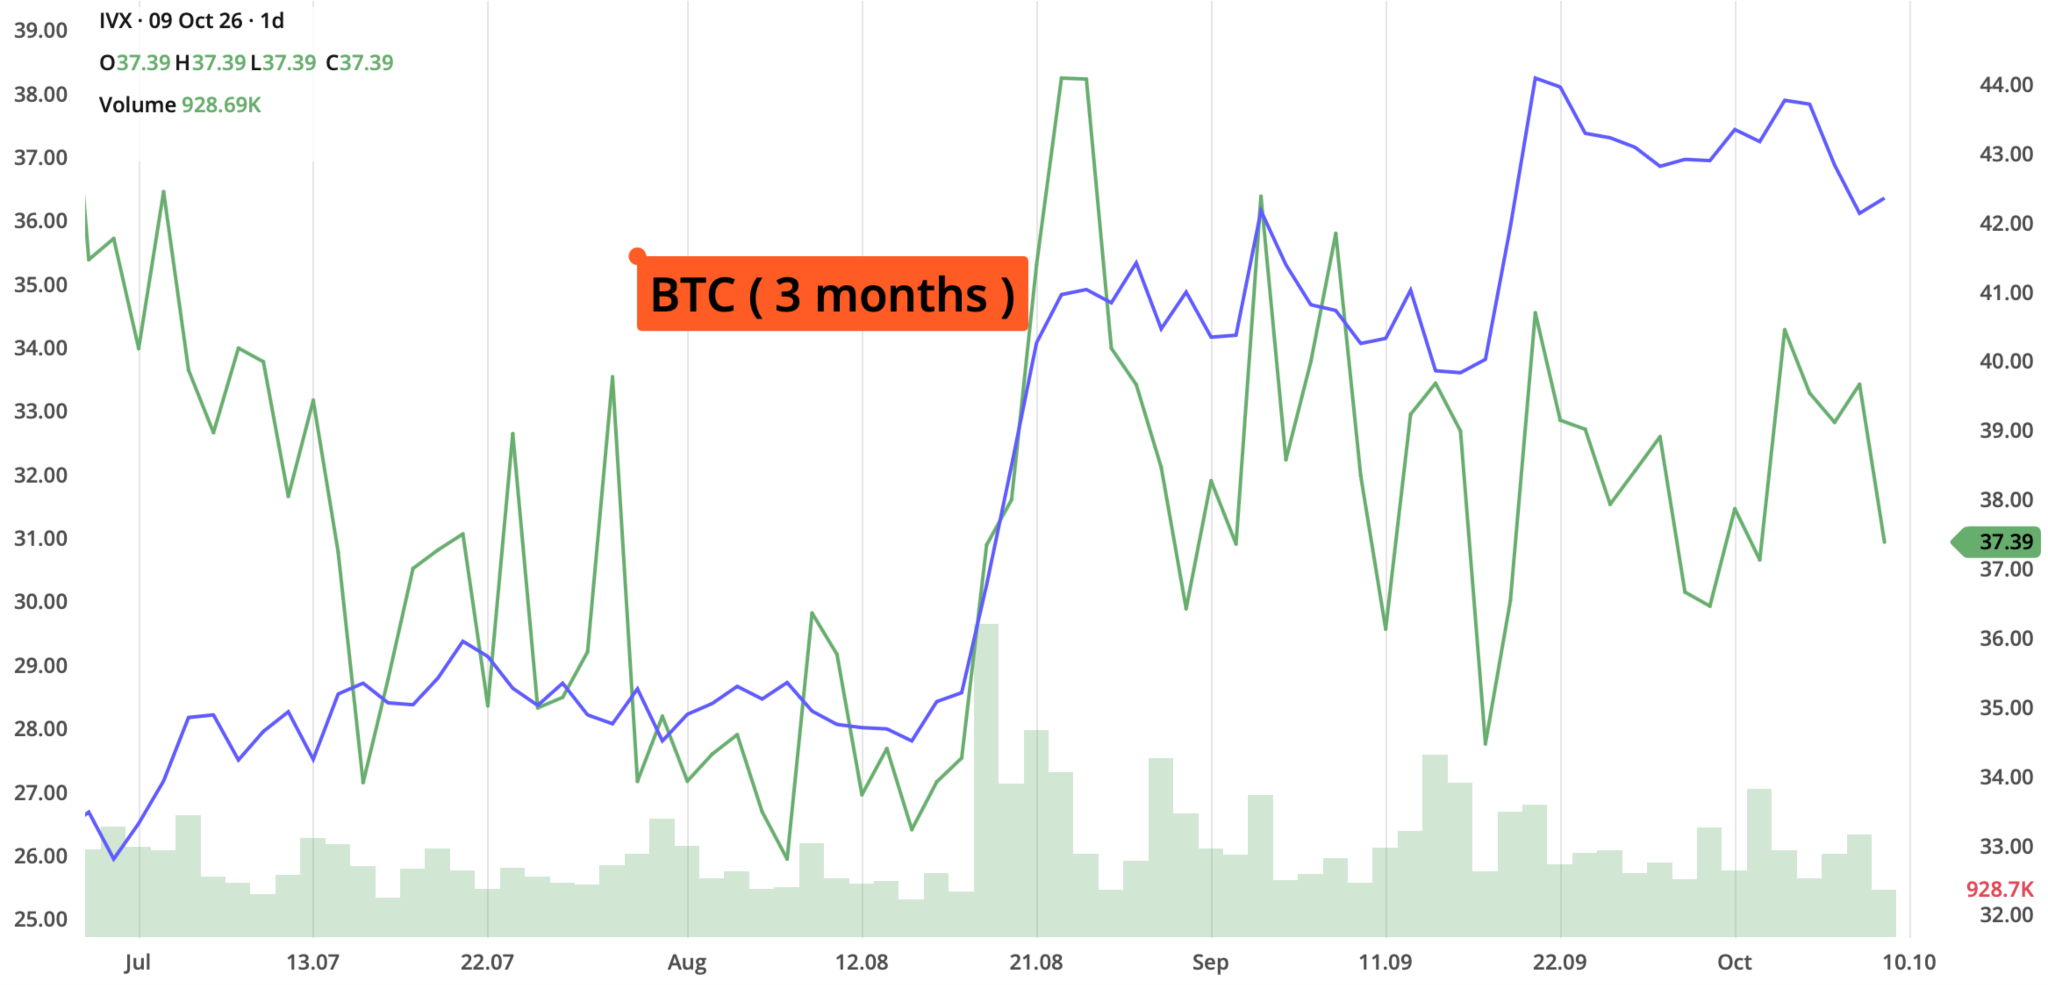
Review selected market indices below:
Daily Notable Market Action
Market Summary for Monday, Oct 5th
Equities: Equities started the week under modest pressure as rate-sensitive segments reacted to sticky underlying yields, with small caps lagging while large-cap growth attempted to find footing. (S&P 500 Close: 7,722.50)
Bonds: Treasury yields held near their elevated cycle boundaries, keeping fixed income under selling pressure. (10-Year Treasury Yield Close: 5.18%)
Oil: Crude oil hovered firmly above the $100-per-barrel threshold amid persistent supply-chain and geopolitical assessments. (Crude Oil Close: $101.40)
Gold: Gold experienced profit-taking pullbacks from recent highs under the weight of firm yields. (Gold Close: $4,185.20)
Digital assets: Digital assets consolidated near immediate range support with subdued retail volumes. (Bitcoin Close: $80,450.00)
Market Summary for Tuesday, Oct 6th
Equities: Markets experienced sharp intraday volatility as sector rotation accelerated; while tech-adjacent mega-caps attracted selective dip-buying, cyclical components wrestled with margin and cost headwinds. (S&P 500 Close: 7,745.10)
Bonds: Fixed-income markets saw sharp swings across the yield curve before stabilizing into the close. (10-Year Treasury Yield Close: 5.21%)
Oil: Oil prices remained well-bid near triple-digit territory, underpinned by tight physical inventories. (Crude Oil Close: $102.15)
Gold: Gold traded defensively as the U.S. dollar found safe-haven bids. (Gold Close: $4,162.80)
Digital assets: Bitcoin and the broader crypto complex faced minor selling pressure alongside equities. (Bitcoin Close: $79,920.00)
Market Summary for Wednesday, Oct 7th
Equities: Equities staged a notable mid-week relief rally, helping indices claw back earlier losses as growth names and select tech leaders led a broad-based recovery. (S&P 500 Close: 7,780.40)
Bonds: Bonds mounted a powerful counter-trend rally that briefly compressed benchmark yields across the curve. (10-Year Treasury Yield Close: 5.16%)
Oil: Crude oil consolidated recent gains in relatively quiet holiday-thinned trade. (Crude Oil Close: $101.90)
Gold: Gold found stabilizing bids near technical support levels following the prior days' pullbacks. (Gold Close: $4,179.50)
Digital assets: Digital assets attempted a quiet recovery bounce, tracking the broader risk-on sentiment in equities. (Bitcoin Close: $81,300.00)
Market Summary for Thursday, Oct 8th
Equities: The tape turned choppy as stronger-than-expected economic data stoked fresh inflation anxieties and a corporate revenue narrative scare within the AI complex triggered temporary jitters across high-beta growth shares. (S&P 500 Close: 7,765.36)
Bonds: Treasury yields pushed higher once more—briefly re-testing cycle peaks—as fixed-income investors digested persistent pricing pressures. (10-Year Treasury Yield Close: 5.22%)
Oil: Oil prices held firm above $100, maintaining strength despite broader macroeconomic crosscurrents. (Crude Oil Close: $103.50)
Gold: Gold drifted lower under the combined weight of higher real yields and a firmer dollar. (Gold Close: $4,144.04)
Digital assets: Digital assets chopped sideways, struggling to break out of tight near-term technical ranges. (Bitcoin Close: $81,692.80)
Market Summary for Friday, Oct 9th
Equities: Wall Street finished the week on a strong, resilient note, driven by growing optimism heading into third-quarter earnings and pushing major indices back near their recovery highs. (S&P 500 Close: 7,811.54)
Bonds: Treasury yields edged up slightly to close out the week as bond markets priced in robust economic resilience. (10-Year Treasury Yield Close: 5.24%)
Oil: Crude oil maintained its elevated posture, holding strong above critical psychological thresholds. (Crude Oil Close: $91.85) (Note: WTI benchmark settled at $91.85; Brent closed near $104.72)
Gold: Gold consolidated its weekly losses, stabilizing as traders balanced safe-haven demand against currency fluctuations. (Gold Close: $4,185.00)
Digital assets: Digital assets stabilized near session ranges as participants prepared for the heavy data-and-earnings docket ahead. (Bitcoin Close: $82,585.51)
Notable Earnings Due for week of Oct 12th–16th
The third-quarter earnings season kicks into high gear, headlined by major financial institutions and bellwether multinational corporations. Wall Street will look closely to the big banks for vital commentary on consumer credit health, loan demand, and net interest margins. Concurrently, reports from major healthcare providers, semiconductor equipment makers, and transport giants will provide a broad cross-section of corporate performance and macro demand trends as the fourth quarter unfolds.
The actual earnings date may vary, so traders should confirm with their brokers. If a trader wishes to open a position to participate in earnings announcements, it is important to check whether the earnings are released BEFORE the markets open or AFTER the markets close on the date of earnings.
Mon, Sep 28th: no notable earnings announcements expected
Tue, Sep 29th: C / GS / JNJ / JPM / UNH / WFC
Wedn, Sep 30th: ASML / BAC / BLK / MS / PGR
Thu, Oct 1st: AA / SCHW / TSM
Fri, Oct 2nd: no notable earnings announcements expected
Economic Calendar Due for week of Oct 12th–16th
The economic calendar now shifts firmly back toward consumer and wholesale inflation, retail momentum, and regional manufacturing health. Following a quiet start to the week alongside a bank holiday, the focal point centers on Wednesday's release of the Consumer Price Index (CPI), which will offer critical signals on underlying price pressures and dictate near-term policy expectations. Rounding out the back half of the week, market participants will closely evaluate the Producer Price Index (PPI), Retail Sales, initial jobless claims, and industrial output to gauge the underlying durability of the consumer and broader economic activity.
Monday, October 12
- U.S. Bank Holiday: Columbus Day / Indigenous Peoples' Day.
Bond markets are closed, equity exchanges remain open but no major economic releases scheduled. Reduced liquidity and holiday-thinned trading volumes across fixed-income markets can occasionally exaggerate intraday price swings in equities.
Tuesday, October 13:
- NFIB Small Business Optimism Index (September)
Serves as a reliable temperature check on Main Street confidence, hiring intentions, and cost pressures. Stronger small-business sentiment highlights domestic economic resilience, while persistent margin concerns signal ongoing corporate headwinds. - Existing Home Sales (September)
Measures transaction volumes in the secondary housing market, providing a direct window into consumer mobility and affordability constraints. Sluggish sales reflect lingering mortgage rate friction, while any unexpected bounce points to pent-up buyer demand. - Federal Budget Deficit (September)
Details the government's monthly fiscal shortfall, offering a lens into federal borrowing needs and long-term debt trajectories. Widening deficits consistently stoke bond market vigilance regarding supply absorption and upward pressure on long-term yields.
Wednesday, October 14
- Consumer Price Index (CPI) and Core CPI (September)
Acts as the marquee inflation gauge for monetary policy, dictating the Federal Reserve's path on interest rate decisions. Softer readings reinforce rate-cut hopes and equity rallies, whereas sticky core inflation pressures risk sparking immediate bond sell-offs. - Federal Reserve Beige Book
Provides anecdotal grassroots color from the twelve Federal Reserve districts on local business conditions, hiring, and pricing power. Markets parse this text closely for early signs of regional economic slowing or sector-specific distress.
Thursday, October 15
- Producer Price Index (PPI) and Core PPI (September)
Measures inflationary pressures at the wholesale level before they reach the end consumer. Accelerating producer costs foreshadow margin compression for corporations or future pass-through price hikes for buyers. - Retail Sales and Retail Sales ex-Autos (September)
Represents the premier gauge of consumer spending vigor, which drives roughly two-thirds of U.S. economic activity. Robust retail figures validate economic soft-landing optimism, whereas weak tallies immediately raise growth slowdown concerns. - Weekly Initial Jobless Claims
Offers the most timely weekly read on labor market stability and corporate layoff trends. Unexpected spikes in claims signal cooling employment conditions, while steady readings comfort investors about consumer income security. - Manufacturing Index (October)
Deliver early regional snapshots of industrial health, factory orders, and business sentiment in key manufacturing hubs. Positive prints point to industrial stabilization, while deeper contractions suggest ongoing goods-sector fatigue. - Business Inventories (August)
Gauges the balance between corporate stock-piling and end-market demand. Rising inventory imbalances can lead to future discounting and production slowdowns, impacting near-term corporate earnings.
Friday, October 16
- Import and Export Price Indices (September)
Measures the cost of goods traded internationally, reflecting global supply chain pressures and foreign demand trends. Rising import prices can reintroduce imported inflation into the domestic economy. - Industrial Production and Capacity Utilization (September)
Tracks real output across factories, mines, and utilities alongside the degree to which productive resources are employed. High utilization rates signal a humming industrial economy, while declining output hints at economic deceleration.
Blue Sky Horizons
The Power Behind the Prompt — Navigating the Data Center Super-Cycle
Few themes have dominated modern capital expenditures quite like the exponential expansion of data centers, which have rapidly evolved from traditional enterprise server rooms into the critical industrial engines of the artificial intelligence era. As the demand for high-performance computing, massive LLM training runs, and real-time inference workloads skyrockets, the modern data center is undergoing a radical architectural transformation. Today's facilities require unprecedented power densities, advanced liquid-cooling systems, and ultra-low-latency network fabrics that push the boundaries of civil engineering and electrical grid capabilities. This massive buildout is no longer just a software or semiconductor story; it has become an industrial-scale race for reliable, continuous baseload power, compelling tech giants to forge direct partnerships with nuclear, natural gas, and renewable energy providers. For forward-looking market participants, the data center evolution represents a multi-year infrastructural super-cycle where the primary bottlenecks—and thus the greatest opportunities—lie in power generation, grid interconnection, specialized cooling, and advanced site modularity.
TAKEAWAYS
For self-directed investors looking to track the leaders and beneficiaries of this data center super-cycle, several foundational companies deserve a prominent place on your focus lists. In the realm of critical power infrastructure and nuclear energy solutions, Constellation Energy (CEG) and NextEra Energy (NEE) stand out as crucial partners supplying the massive, carbon-free baseload energy required to keep hyperscale facilities running 24/7. For specialized thermal management and liquid-cooling solutions that prevent overheating in high-density AI clusters, Vertiv Holdings (VRT) remains an essential infrastructure enabler. On the hardware and networking side, Super Micro Computer (SMCI) and Arista Networks (ANET) provide the high-performance server architectures and switching backbones that allow massive data center pods to operate as unified, ultra-fast supercomputers. Adding these names to your radar helps capture the physical and electrical backbone powering the next generation of digital infrastructure.
Thank you for reading. Until next week's close,
Have a safe and productive Trading week!
Fauzia Timberlake
About the Author: Fauzia Timberlake is a professional options coach and financial strategist specializing in risk management and portfolio architecture for self-directed investors. She is Founder and Managing Partner of Option Engines.
Questions / Comments
We're here to serve IVolatility users and we welcome your questions or feedback about the option strategies discussed in this newsletter. If there is something you would like us to consider and/or analyze, we're always open to your suggestions. Use support@ivolatility.com.
Previous issues are located under the Trade Ideas tab on our website.